
Summary: One of the mysteries of the public climate change debate (now encompassing extreme weather) is the reliance of journalists and interested people on fringe sources when NOAA and the other climate agencies produce clear and timely articles. Such as NOAA’s about this El Niño, including this new one that tells us about this important weather event — and debunks much of what you’ve been told.

NOAA’s February 2016 El Niño update (plus Q&A)
By Emily Becker, climate scientist at NOAA, 11 February 2016
Despite getting a little boost from some strong winds across the tropical Pacific Ocean in January, the warmer-than-average ocean temperatures that drive El Niño have likely peaked. Now that we’re looking out from the other side of the mountain, let’s answer some questions.
Is this the strongest El Niño on record?
This is definitely one of the strongest three going back to 1950. It’s hard to say definitively what single El Niño is the strongest, because there are many different ways to measure strength.
The Oceanic Niño Index, the three-month-average sea surface temperature departure from the long-term normal in one region of the Pacific Ocean, is the primary number we use to measure the ocean part of El Niño, and that value for November – January is 2.3°C, tied with the same period in 1997-98. There are other areas of the ocean that we watch, though, including the eastern Pacific (warmer in 1997/98) and the western Pacific (warmer in 2015/16).
Also, don’t forget the “SO” part of the El Niño/Southern Oscillation (ENSO), which is the all-important atmospheric response. All that extra heat in the tropical Pacific Ocean warms up the atmosphere above it, leading to more rising air, which changes the circulation all around the globe. By one measure (the EQSOI), the El Niño-related changes in the atmospheric circulation in 1997/98 and 2015/16 are tied; by another (the SOI), 1997/98 was stronger.

Location of the stations used for the Southern Oscillation Index (Tahiti and Darwin, black dots), the Equatorial Southern Oscillation Index (eastern equatorial Pacific and Indonesia regions, outlined in blue), and the Niño3.4 region in the east-central tropical Pacific Ocean for sea surface temperature (red dashed line). NOAA Climate.gov image by Fiona Martin.
We also look at tropical Pacific near-surface winds , subsurface ocean temperatures, upper-atmosphere winds, cloudiness… the list goes on! The image of tropical cloudiness (an indicator of rainfall) below is a good example of how a single index number over a single region doesn’t give you the whole picture of an El Niño’s “personality.”

Clouds and precipitation during January 1998 (left) and January 2016 (right). Clouds can be detected by satellites because they block the amount of longwave radiation leaving the earth’s surface (OLR). Image by Michelle L’Heureux and NOAA, from CPC data.
The El Niño-related cloudiness and rainfall pattern extended farther east along the equator in 1998, stretching all the way to the South American coast. These patterns are closely linked to the changes El Niño causes to global circulation, and therefore to El Niño’s impact on weather and climate.
In short, we can argue over which El Niño is stronger, or we can argue about who’s the better quarterback, John Elway or Peyton Manning. Hm… the Denver Broncos won the Super Bowl in both the 1997 and 2015 seasons…
This month’s Niño3.4 is a few hundredths of a degree above Jan 1997. Is that a record?
Maybe. Maybe not. Part of the difficulty in assigning “record” status in a close contest is that we just can’t measure the temperature of every molecule of water in the tropical Pacific. (And satellites don’t have magical space thermometers.) So there’s always some uncertainty in the measurement.
We checked with our colleagues at NOAA’s National Center for Environmental Information, who told us that, for this dataset, the ERSSTv4, the uncertainty in those final numbers beyond the decimal point prevents a declaration of “record!” The uncertainty in this one dataset is not huge, as you can see in the shaded area below, but it’s bigger than the difference between 1998 and 2016.
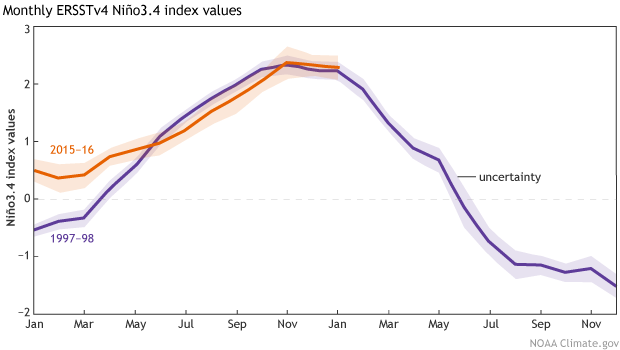
Monthly Niño3.4 Index, from ERSSTv4 data. Shaded area indicates the uncertainty. Image by Michelle L’Heureux and NOAA, from NCEI data.
Last month you said the Oct – Dec Niño3.4 avg was 2.3°C above normal; now it says 2.2°C
This is related to the uncertainty I just mentioned. At the end of every month, there are some missing observations from that month. These observations have to be filled in using a statistical method, and it’s not finalized until the end of the next month. There aren’t a lot of these points, but enough that they can slightly change the average, which is what happened for October–December.
What’s the deal with California rain? And the drought?
Tom Smith just wrote about that: “Rains return to California to start 2016“!
Was the East Coast blizzard caused by El Niño?
I think it was caused by the Denver Broncos. I kid!
It’s just not possible to attribute a single storm to one climate influence, especially such a complicated storm as a snowy nor’easter. A lot of components had to come together to create that blizzard, including a cold snap, warm Atlantic Ocean waters to feed moisture to the storm, and a strong frontal system, among others. El Niño’s fingerprint may have been present in some of those factors, but it’s really tough to separate it out.
El Niño does tend to create conditions that steer storms across the Gulf states, Florida, Georgia, and the Carolinas; typically, these storms will exit to the Atlantic south of Maryland/Virginia. The more northward track of this storm is somewhat unusual for El Niño-related conditions, but not unheard of.
What’s next?
The official El Niño/Southern Oscillation forecast says it’s likely the tropical Pacific will transition to neutral conditions (sea surface temperature in the Niño3.4 region dropping below the 0.5°-above-normal threshold) in the late spring. The longer-term outlook for early fall is slightly favoring La Niña conditions by September-November, which would be consistent with the historical tendency for strong El Niño events to be followed by La Niña. Computer models still have a wide range of possible outcomes for next fall, though, so stay tuned!

North American Multi-Model Ensemble (NMME) forecast for the monthly Niño3.4 Index. Each gray line is an individual computer model forecast (107 in total) and the black dashed line shows the average. Image by climate.gov from CPC data.
——————————–
About the author
Emily Becker is a climate scientists with NOAA. She has a Ph.D. in atmospheric science from the U of Maryland.
Other posts about this El Niño
- Learning from 2014: Looks like yet another false alarm. Probably no super monster El Niño coming this year.
- Choose your facts: learn about the El Niño from journalists or activists.
- Prepare for a clickbait avalanche about the super El Niño!
- El Niño, The Media Star: Separating Hype from Probability — From the Browning World Climate Bulletin.
- Update on El Niño: will Gaia disappoint the climate activists?
- This El Niño is not Godzilla. What can we learn from the 2 years of hype?
- NOAA debunks the hysteria about this El Niño. Why don’t we listen?
- NOAA’s winter update: about the weird warmth and the El Niño.
- How much damage has this El Niño done?
For More Information
If you liked this post, like us on Facebook and follow us on Twitter. For more information about this vital issue see The keys to understanding climate change and My posts about climate change.

Kelvin waves, Rossby waves. Sloshing, and sloshing back.
Godzilla appears to be being beaten by Mothra (or is it the other way ’round?).
Yeah, we get all our news from “fringe” sources like you, who change their stories every other day so you’re always “right” no matter what actually happens.
Marcus,
(1) “we get all our news from “fringe” sources like you”
Can you provide any evidence of that?
Your comment is self-refuting, on a post to a NOAA article — the most recent in a series about El Nino citing NOAA and other professional sources (see the links at the end).
(2) “who change their stories every other day so you’re always “right” no matter what actually happens.”
Examples? This series has quoted almost exclusively NOAA reports. Not only has NOAA not “changed their story” about this El Nino, but their forecast has proven to be quite accurate.
Even for a troll your comment is quite weak.
This is one of your few objective, informative posts. Let’s have more like it!
Thanks, Bill
Will B. (Bill) Betchart, P. E. Consulting Water Resources Engineer
{Editor: personal information deleted from this comment.}
Will,
(1) “This is one of your few objective, informative posts.”
Your comment is self-refuting. It’s weak — even for a troll. This is the latest in long series about the El Nino. All cite NOAA and other professional sources. More broadly, my posts about climate rely on (& cite) information from the IPCC and the major climate agencies.
For your clients’ sake, let’s hope your professional work is more accurate.
(2) “Let’s have more like it!”
Let’s have fewer comments that make unsubstantiated smears — like yours.
Obviously it’s Peyton Manning.
The current El Niño active since summer 2015, is one of the three strongest ever recorded, as long as one reduce the observation period to the last couple of decades. However we know that there was a El Niño during the first winter in World War II (WWII). In Europe the winter was the coldest for more than 100 years. In the U.S. a number of States experienced an extraordinary dry and warm autumn 1939, and record cold in January 1940 as well.
If you’re interested in this subject, here are some myth-busting explanations: “In El Niño matters: “Ask the Experts” but expect nothing!“
Smamarver,
The Southern Oscillation Index provides a good proxy for the long-term ENSO history. The record lows (corresponding to El Ninos) of 1896 and 1895 are large larger than the current cycle. Click to enlarge.