

Summary: As the climate policy wars go for higher stakes, the public debate (among non-scientists) shifts from science to propaganda (both Left and Right, each in their distinctive way). That’s rational, since modern Americans are so gullible — and have no resentment towards those who lie to them. The tribe is all that matters. When we break these fetters of the mind, we’ll be ready for the challenges of the 21st century.

Contents
- The smoking gun among the global warming fraudsters
- The latest hockey stick of global temperatures
- America is burning!
- Increasing number of tornadoes
- About global warming
- For More Information
.
(1) The smoking gun among the global warming fraudsters
“Unless we announce disasters, no one will listen.”
— Sir John Houghton in his book Global Warming: The Complete Briefing. He was co-chairman of the IPCC’s scientific assessment group.
Is this quote incriminating, deserving its 700 thousand hits on Google? No. Like so many powerful quotes circulated among conservatives, it is fake (see details in The Independent). None of those thousands of writers bothered to check the quote (note: all quotes on the FM website are checked). Any more than for the widely circulated ones about democracy and about guns,
The incidence of fake quotes shows the contempt for their audience that almost defines conservative leaders, and the movement’s contempt for facts. Next, we see how the Left uses straightforward misinformation to gain your trust. The truth is out there, but both sides find that lies are more politically useful. We can change that.
(2) The latest hockey stick of global temperatures
A firestorm of alarm was ignited by the most recent temperature “hockey stick”: “A Reconstruction of Regional and Global Temperature for the Past 11,300 Years“, Shaun A. Marcott et al, Science, 8 March 2003. Especially this graph:
.
Globally stacked temperature anomalies for the 5° × 5° area-weighted mean calculation (purple line) with its 1σ uncertainty (blue band) and Mann et al.’s global CRU-EIV composite mean temperature (dark gray line) with their uncertainty (light gray band).

Stephen McIntyre of climateaudit.org reviewed this article and noticed oddities in the data and analysis. In response the authors release a statement with additional details, including this remarkable admission:
Our global paleotemperature reconstruction includes a so-called “uptick” in temperatures during the 20th-century. However, in the paper we make the point that this particular feature is of shorter duration than the inherent smoothing in our statistical averaging procedure, and that it is based on only a few available paleo-reconstructions of the type we used. Thus, the 20th century portion of our paleotemperature stack is not statistically robust, cannot be considered representative of global temperature changes, and therefore is not the basis of any of our conclusions.
The 20th century temperature spike is, of course, the aspect of their article that provoked the publicity. Yet despite this admission, this graph still appears in the work of lay climate activists — without mention of the authors’ disclaimer. Such as this article by propagandist Phil Plait at Slate.
(3) About wildfires: America is burning
The US Forest Service’s 1905 – 1974 policy of fire suppression turned much of our western forests into tinderboxes. Despite this well-documented fact (with no easy solution), it’s become fashionable to describe this year’s fires as extraordinary. They’re not, in either number or size, as shown by these numbers from the National Interagency Fire Center. Number of fires and total acres burned:
| Year-to-date statistics | ||
| 2013 (1/1/13 – 7/8/13) | Fires: 23,629 | Acres: 1,879,510 |
| 2012 (1/1/12 – 7/8/12) | Fires: 30,284 | Acres: 2,519,367 |
| 2011 (1/1/11 – 7/8/11) | Fires: 38,452 | Acres: 4,926,718 |
| 2010 (1/1/10 – 7/8/10) | Fires: 32,210 | Acres: 1,522,909 |
| 2009 (1/1/09 – 7/8/09) | Fires: 46,769 | Acres: 2,089,463 |
| 2008 (1/1/08 – 7/8/08) | Fires: 46,113 | Acres: 2,719,679 |
| 2007 (1/1/07 – 7/8/07) | Fires: 49,167 | Acres: 1,292,673 |
| 2006 (1/1/06 – 7/8/06) | Fires: 61,180 | Acres: 3,994,924 |
| 2005 (1/1/05 – 7/8/05) | Fires: 32,416 | Acres: 2,978,279 |
| 2004 (1/1/03 – 7/8/04) | Fires: 40,470 | Acres: 2,922,638 |
| 10-year average: 2004-2013 | Fires: 40,069 | Acres: 2,784,616 |
.
In terms of annual totals, 2006 & 2007 were the record years (followed by 2011 & 2012) — but the state of our forests mean these records probably will get broken. Also compare this list of recent large fires (1997-now) with noteworthy wildfires of the past two centuries.
For more information see this history of the 1910 fire season (over 5 million acres burned), this history of the Forest Service’s prevention programs, and the Wikipedia’s list of the largest forest fires in North America.
(4) Increasing number of tornadoes
Every severe outbreak of tornadoes brings allusions to global warming, and warnings about the wraith of nature to come from more death-funnels from the sky. The National Weather Service website says otherwise. First, let’s look at this year vs. recent history.
.
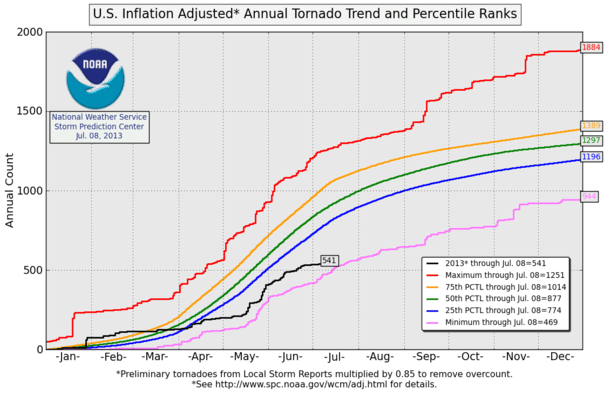
Next, what’s the trend?
“… the increase in tornado reports over the last 54 years is almost entirely due to secular trends such as population increase, increased tornado awareness, and more robust and advanced reporting networks.”
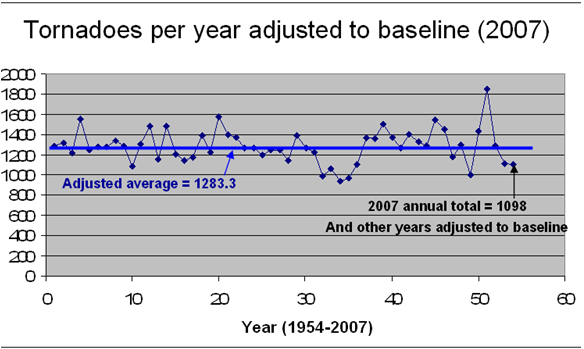
NOAA says the same:
With increased national Doppler radar coverage, increasing population, and greater attention to tornado reporting, there has been an increase in the number of tornado reports over the past several decades. This can create a misleading appearance of an increasing trend in tornado frequency. … The bar charts below indicates there has been little trend in the frequency of the stronger tornadoes over the past 55 years.
(5) About global warming
While cheering madly (ie, irrationally, emotionally, hysterically) for their faction of scientists, laypeople often lose sight of the big picture — the key elements for making public policy.
- The major global temperature measurement systems tell — broadly speaking — the same story since the late 1970s: two decades of warming, followed by a pause.
- This is consistent with the larger firm conclusions of climate scientists: two centuries of warming, coming in pulses (ie, waves), with anthropogenic factors becoming the largest (not the only) drivers since roughly 1950.
- The work of the IPCC and the major science institutes are the best guides for information about these issues.
(6) For More Information
To learn more about trends in extreme weather:
- About hurricane activity: global hurricane frequency (peer-reviewed version in GRL here); and a more US-centric version here. No clear trend.
- About droughts see the Contiguous US Palmer Modified Drought Index (PMDI) for 1895-2012, NOAA — The 2012 drought was not extreme.
- Rutgers University Global Snow Lab has an easy to use graphs of northern hemisphere snowfall from 1967. No extreme trends.
- NOAA’s US Climate Extremes Index — An excellent source of easy to review data.
- The Global Weather & Climate Extremes Archive of the World Meteorological Organization — Note the list of extremes & dates on the front page.
Posts about extreme climate trends:
- Climate Armageddon postponed (again): the melting polar ice, 9 October 2010
- Looking into the past for guidance about warnings of future climate apocalypses, 17 October 2010
- Run from the rising waves! (The latest climate catastrophe scare), 27 June 2012
- Ignorance and propaganda about extreme climate change, 10 July 2012
- A look behind the curtain at the news of extreme climate events in the US, 22 August 2012
- Hurricane Sandy asks when did weather become exceptional? (plus important info about US hurricanes), 28 October 2012
- Has global warming increased the frequency & virulence of extreme weather events?, 10 February 2013
- The Oklahoma tornadoes can teach us about our climate, and ourselves, 22 May 2013
.
.
