

Summary: Al Qaeda (Bin Laden’s organization, if it still exists in meaningful form) is a threat to America. A greater threat are our CEO’s, some of whom who have discovered discovered a formula to vast personal wealth: leverage the company up (borrow), use those funds to buy back stock (boosting earnings per share), cut capital expenditures (capex) to boost short-term profits, pay most of the profits in dividends — all of which disguises massive payouts to senior managers (via salary, benefits, pensions, golden parachutes, grants of stock and stock options, etc). They’re strip-mining away America’s future. Slowly people begin to fit these pieces together. Today we help you to do so.
.
Contents
- An example of how it’s done
- Cutting capex: short-selling the future
- For More Information
.
(1) An example of how it’s done
List most stories about corporate finance, it’s complex. These articles clearly explain the game using IBM as an example (just one of many), but have to be read. The excepts are just teasers.
(a) “Stockholders Got Plundered In IBM’s Hocus-Pocus Machine“, Wolf Richter, Testosterone Pit, 17 October 2013 — Opening:
I’m not picking on IBM. I’m almost sure they have some decent products. So they had a crummy quarter – the sixth quarter in a row of sales declines. And their hardware sales in China have collapsed since Snowden’s revelations about the NSA and its collaboration with American tech companies. But in one area, IBM excels: its hocus-pocus machine.
IBM isn’t alone in its excellence and isn’t even at the top of the heap in that respect. There are many corporations like IBM, mastodons that successfully pull a bag over investors’ heads, aided and abetted by Wall Street with its “analysts,” and by the Fed, to hide the stockholder plunder taking place behind a billowing smokescreen of verbiage.
(b) “Big Blue: Stock Buyback Machine On Steroids“, David Stockman, at his website Contra Corner, 17 April 2014 — Opening:
The Fed’s financial repression policies destroy price discovery and honest capital markets. In the process these deformations turn financial markets into casinos and corporate executives into prevaricating gamblers. To be specific, most CEOs of the Fortune 500 are no longer running commercial businesses; they are in the stock-rigging game, harvesting a mother lode of stock option winnings as the go along.
Those munificently rising stock prices and options cash-outs owe much to the Fed’s campaign to suppress interest rates and fuel stock market based ”wealth effects”, but the CEOs are doing their part, too. They have become full-time financial engineers who use the Fed’s flood of liquidity, cheap debt and soaring stock prices to perform a giant strip-mining operation on their own companies. That is, through endless stock buybacks and M&A maneuvers they create the appearance of “growth” while actually liquidating the balance sheet equity and future asset base on which legitimate earnings growth depends.
.
The poster boy for this deformation is IBM which for all intents and purposes has become a stock buyback machine on steroids. It had a bad hair day yesterday, reporting still another year/year decline in sales, but that goes right to the heart of the matter. During the last seven years IBM has been a stock traders dream, climbing an almost picture perfect chart from $94 per share in March 2007 to a recent peak of $212.
But as shown below, those gains had nothing to do with what has been a historic ingredient of stock appreciation—- namely, expansion of its asset base and revenues. In fact, sales revenues in Q1 2014 clocked in at virtually the same number as Q1 2007 …
(c) “The Great Stock Buyback Craze Is Finally Ending“, Zero Hedge, 17 April 2014 — Opening:
… as we forecast first in 2012, all that investment grade companies like IBM have done in the New Normal in order to preserve the illusion of growth, is to use cash from operations, or incremental zero-cost leverage, to fund stock buybacks with the express goal of reducing the number of shares, and hence dilution, in the EPS calculation. In essence a balance sheet for income statement tradeoff. Earlier today, David Stockman touched just on this issue.
However, that “great stock buyback craze” as we call it, is finally coming to an end. Why?
Before we explain, in order for readers to get a sense of the true perspective of how massive IBM’s stock buybacks have been over the past two years, here is a chart showing the quarterly amount of net debt issued by Big Blue as well as the total notional in stock buybacks.
(d) “Cash Does Not Mean Capex, IBM Edition“, Jeffrey P. Snider, Seeking Alpha, 17 April 2014
Related to yesterday’s observations about corporate cash, the broken record of IBM (IBM) revenue continues to demonstrate the unwillingness of American businesses to freely spend on capex.
(2) Cutting capex: short-selling the future
What America’s corporations are not doing: investing in their businesses. Cutting capex means big profits in the present — and big paychecks for the senior executives — but a weak future for the company. It’s just one ill consequence of the paradigm for the successful modern American CEO.
(a) “Ending corporate America’s investment drought“, Financial Times, 23 January 2014 — Opening:
If 2014 is the year the US economy finally picks up speed, it ought to be the moment companies start investing. US non-financial companies are sitting on record levels of cash – almost $1.5tn. Alas, there is scant sign that chief executives are preparing to put their balance sheets to better use. The latest survey of non-financial companies in the S&P 500 index shows they are expected to boost capital expenditure by just 1.3 per cent for the year ending in June, according to Factset, a data company. This hardly looks like a vote of confidence in the US recovery. Unless companies show signs of stepping up their investments, there will be a question mark over its sustainability.
(b) “Don’t Blame Regulation For Capital Spending Drought“, Martin Fridson, blog of Forbes, 7 March 2014 — Excerpt:
Why is Corporate America holding back on plant-and-equipment outlays?
… Continuing a line of argument dating back to the New Deal, some observers have blamed it all on regulatory burdens and associated uncertainty. One trade publication writes, “Uncertainty over the Affordable Care Act, debate over increase in the minimum wage, and increased government regulations are considered disincentives to business hiring and investing.”
… Attributing anemic capital spending to regulatory uncertainties is unjustified, however, when a simpler explanation is readily at hand. According to the Federal Reserve Board, only 79.2% of productive capacity is currently being utilized. Companies do not typically begin to feel capacity-constrained until that ratio climbs above 80%. It is hardly surprising that with over 20% of their present capacity idle, CEOs are in no hurry to add more.
The ISM survey respondents mention two additional challenges that concern them—slow growth of domestic sales and slow growth of international sales. We can reasonably assume that when sales pick up, factories will operate at a higher rate and companies will increase their capacity. Jumping the gun, on the other hand, would create even more idle capacity. That would likely depress prices and hurt profit margins.
(c) “The cap-X Factor”, Savita Subramanian et al, BofA – Merrill Lynch, 11 March 2014 — Excerpt:
The average age of US private non-residential fixed assets is currently 15.9 years — the highest since 1965. Breaking this down into its components, the average age of structures (power plants, hospitals, restaurants, etc.) is 22.2 years.
This is the highest since 1964, and implies that the average structure was built in 1992, the year that the European Union was formed and the first text message was sent. The average age of equipment (computers, medical equipment, machinery, airplanes, etc.) is 7.4 years (highest since 1995) and the average age of intellectual property products (software, research & development, etc.) is 4.4 years (the highest since 1983).… For most sectors outside of Energy and Financials , in 2010 capital investment dropped to a level that failed to even keep up with depreciation & amortization (D&A) , as shown in Chart 18 . Typically, capex trends well above D&A for two reasons:
- D&A is based on historical cost and is not adjusted for inflation, and
- capex includes both growth and maintenance capex.
Capex/D&A has since recovered, but at 1.2 it remains well below the historical average of 1.4, suggesting that companies remain hesitant to invest in growth.

(d) “The capex call“, Cardiff Garcia, Financial Times Alphaville, 28 March 2014 — Reviewing the numbers and the trends. Excerpt:
Like other parts of the US economic recovery — housing, the labour market — capital expenditures by companies have been a letdown recently, even accounting for the weather. … But capex has been disappointing for more than a year. The growth rate of investment in both equipment and structures declined last year after a strong 2012, which economists credit partly to a one-off tax incentive that pulled investment forward in time.
… Here are the reasons given for the anticipated gains, with a few caveats of our own tacked on at the end …
The mystery of stagnant investment remains, well, mysterious. Net business investment has peaked lower (as a share of GDP) in each successive recovery since the 1980s.
Profit margins remain stubbornly wide, while revenue growth is projected to slow further this year. If companies become nervous that wage growth, whose mildness has been largely responsible for the rebound in profits, will climb without offsetting expectations of higher sales, they’ll become even more loathe to either hire or invest in new equipment.
(3) For More Information
(a) About CEO pay:
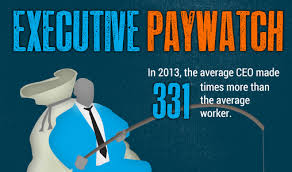
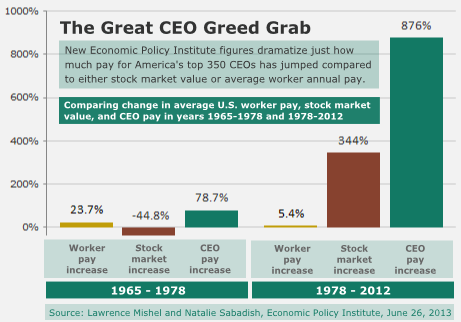
- “CEO Pay in 2012 Was Extraordinarily High Relative to Typical Workers and Other High Earners“, Lawrence Mishel and Natalie Sabadish, Economic Policy Institute, 26 June 2013
(b) Other posts about capital expenditures:
- Why America’s growth is slowing, and a solution, 28 January 2013
- Portraits of a nation in decline. An unnecessary and easily fixed decline., 14 February 2013
- Four graphs showing a nation in decline. An unnecessary and easily fixed decline., 1 November 2013
.
.

.
.