

Summary: Today we have a post by Judith Curry, a leading climate scientist, going to the very heart of the debate: how much of the warming since 1950 results from us? Before making predictions, how confidently can we see our past?
Climate change presents one of the greatest challenges in humanity’s history. To accurately assess long slow changes in Earth’s biosphere, discerning the effects of our effects from natural cycles. Equally difficult, our political machinery must accurately see the conclusions of climate scientists, and take appropriate steps. These are largely sociological processes, called upon to work on a level seldom seen in our past.

.
Contents
- The 50-50 argument
- About Judith Curry
- Vital info about climate change
- For More Information
- Advice from Bertrand Russell
.
“The 50-50 argument“
by Judith Curry, at her website Climate Etc
24 August 2014
Posted here under her Creative Commons license
(a) Choose which hypothesis you prefer
Pick one:
- Warming since 1950 is predominantly (more than 50%) caused by humans.
- Warming since 1950 is predominantly caused by natural processes.
When faced with a choice between 1 and 2, I respond: ‘I can’t choose, since i think the most likely split between natural and anthropogenic causes to recent global warming is about 50-50′. Gavin thinks I’m ‘making things up’ {see the discussion in comments here}, so I promised yet another post on this topic.
For background and context, see my previous 4 part series Overconfidence in the IPCC’s detection and attribution.
(b) Framing
The IPCC’s AR5 (2014) attribution statement:
It is extremely likely that more than half of the observed increase in global average surface temperature from 1951 to 2010 was caused by the anthropogenic increase in greenhouse gas concentrations and other anthropogenic forcings together. The best estimate of the human induced contribution to warming is similar to the observed warming over this period.
I’ve remarked on the ‘most’ (previous incarnation of ‘more than half’, equivalent in meaning) in my Uncertainty Monster paper: “Further, the attribution statement itself is at best imprecise and at worst ambiguous: what does “most” mean – 51% or 99%?” Whether it is 51% or 99% would seem to make a rather big difference regarding the policy response. It’s time for climate scientists to refine this range.
I am arguing here that the ‘choice’ regarding attribution shouldn’t be binary, and there should not be a break at 50%; rather we should consider the following terciles for the net anthropogenic contribution to warming since 1950: >66%, 33% – 66%, <33%. Hence 50-50 refers to the tercile 33-66% (as the midpoint)
Note: I am referring only to a period of overall warming, so by definition the cooling argument is eliminated. Further, I am referring to the NET anthropogenic effect (greenhouse gases + aerosols + etc). I am looking to compare the relative magnitudes of net anthropogenic contribution with net natural contributions.
Further, by global warming I refer explicitly to the historical record of global average surface temperatures. Other data sets such as ocean heat content, sea ice extent, whatever, are not sufficiently mature or long-range (see Climate data records: maturity matrix). Further, the surface temperature is most relevant to climate change impacts, since humans and land ecosystems live on the surface. I acknowledge that temperature variations can vary over the earth’s surface, and that heat can be stored/released by vertical processes in the atmosphere and ocean. But the key issue of societal relevance (not to mention the focus of IPCC detection and attribution arguments) is the realization of this heat on the Earth’s surface.
.

(c) What the IPCC says
Before getting into my 50-50 argument, a brief review of the IPCC perspective on detection and attribution. For detection, see my post Overconfidence in IPCC’s detection and attribution. Part I.
Let me clarify the distinction between detection and attribution, as used by the IPCC. Detection refers to change above and beyond natural internal variability. Once a change is detected, attribution attempts to identify external drivers of the change.
The reasoning process used by the IPCC in assessing confidence in its attribution statement is described by this statement from the AR4 (2007):
“The approaches used in detection and attribution research described above cannot fully account for all uncertainties, and thus ultimately expert judgement is required to give a calibrated assessment of whether a specific cause is responsible for a given climate change. The assessment approach used in this chapter is to consider results from multiple studies using a variety of observational data sets, models, forcings and analysis techniques. The assessment based on these results typically takes into account the number of studies, the extent to which there is consensus among studies on the significance of detection results, the extent to which there is consensus on the consistency between the observed change and the change expected from forcing, the degree of consistency with other types of evidence, the extent to which known uncertainties are accounted for in and between studies, and whether there might be other physically plausible explanations for the given climate change.
Having determined a particular likelihood assessment, this was then further downweighted to take into account any remaining uncertainties, such as, for example, structural uncertainties or a limited exploration of possible forcing histories of uncertain forcings. The overall assessment also considers whether several independent lines of evidence strengthen a result.” (IPCC AR4)
I won’t make a judgment here as to how ‘expert judgment’ and subjective ‘down weighting’ is different from ‘making things up’
AR5 Chapter 10 has a more extensive discussion on the philosophy and methodology of detection and attribution, but the general idea has not really changed from AR4. In my previous post (related to the AR4), I asked the question: what was the original likelihood assessment from which this apparently minimal downweighting occurred? The AR5 provides an answer:
The best estimate of the human induced contribution to warming is similar to the observed warming over this period.
So, I interpret this as scything that the IPCC’s best estimate is that 100% of the warming since 1950 is attributable to humans, and they then down weight this to ‘more than half’ to account for various uncertainties. And then assign an ‘extremely likely’ confidence level to all this.
Making things up, anyone?
I’ve just reread Overconfidence in IPCC’s detection and attribution. Part IV, I recommend that anyone who seriously wants to understand this should read this previous post. It explains why I think the AR5 detection and attribution reasoning is flawed.
Of particular relevance to the 50-50 argument, the IPCC has failed to convincingly demonstrate ‘detection.’ Because historical records aren’t long enough and paleo reconstructions are not reliable, the climate models ‘detect’ AGW by comparing natural forcing simulations with anthropogenically forced simulations. When the spectra of the variability of the unforced simulations is compared with the observed spectra of variability, the AR4 simulations show insufficient variability at 40-100 yrs, whereas AR5 simulations show reasonable variability. The IPCC then regards the divergence between unforced and anthropogenically forced simulations after ~1980 as the heart of the their detection and attribution argument. See Figure 10.1 from AR5 WGI: (a) is with natural and anthropogenic forcing; (b) is without anthropogenic forcing:


.
Note in particular that the models fail to simulate the observed warming between 1910 and 1940.
The glaring flaw in their logic is this. If you are trying to attribute warming over a short period, e.g. since 1980, detection requires that you explicitly consider the phasing of multidecadal natural internal variability during that period (e.g. AMO, PDO), not just the spectra over a long time period. Attribution arguments of late 20th century warming have failed to pass the detection threshold which requires accounting for the phasing of the AMO and PDO. It is typically argued that these oscillations go up and down, in net they are a wash. Maybe, but they are NOT a wash when you are considering a period of the order, or shorter than, the multidecadal time scales associated with these oscillations.
Further, in the presence of multidecadal oscillations with a nominal 60-80 yr time scale, convincing attribution requires that you can attribute the variability for more than one 60-80 yr period, preferably back to the mid 19th century. Not being able to address the attribution of change in the early 20th century to my mind precludes any highly confident attribution of change in the late 20th century.
(d) The 50-50 argument
There are multiple lines of evidence supporting the 50-50 (middle tercile) attribution argument. Here are the major ones, to my mind.
(d1) Sensitivity
The 100% anthropogenic attribution from climate models is derived from climate models that have an average equilibrium climate sensitivity (ECS) around 3C. One of the major findings from AR5 WG1 was the divergence in ECS determined via climate models versus observations. This divergence led the AR5 to lower the likely bound on ECS to 1.5C (with ECS very unlikely to be below 1C). Nic Lewis at Climate Dialogue summarizes the observational evidence for ECS between 1.5 and 2C, with transient climate response (TCR) around 1.3C.
Nic Lewis has a comment at Bishop Hill on this:
The press release for the new study (Science, 22 August 2014) states: “Rapid warming in the last two and a half decades of the 20th century, they proposed in an earlier study, was roughly half due to global warming and half to the natural Atlantic Ocean cycle that kept more heat near the surface.” If only half the warming over 1976-2000 (linear trend 0.18°C/decade) was indeed anthropogenic, and the IPCC AR5 best estimate of the change in anthropogenic forcing over that period (linear trend 0.33Wm-2/decade) is accurate, then the transient climate response (TCR) would be little over 1°C. That is probably going too far, but the 1.3-1.4°C estimate in my and Marcel Crok’s report “A Sensitive Matter” is certainly supported by Chen and Tung’s findings.
Since the CMIP5 models used by the IPCC on average adequately reproduce observed global warming in the last two and a half decades of the 20th century without any contribution from multidecadal ocean variability, it follows that those models (whose mean TCR is slightly over 1.8°C) must be substantially too sensitive.
BTW, the longer term anthropogenic warming trends (50, 75 and 100 year) to 2011, after removing the solar, ENSO, volcanic and AMO signals given in Fig. 5 B of Tung’s earlier study (freely accessible here), of respectively 0.083, 0.078 and 0.068°C/decade also support low TCR values (varying from 0.91°C to 1.37°C), upon dividing by the linear trends exhibited by the IPCC AR5 best estimate time series for anthropogenic forcing. My own work gives TCR estimates towards the upper end of that range, still far below the average for CMIP5 models.
If true climate sensitivity is only 50-65% of the magnitude that is being simulated by climate models, then it is not unreasonable to infer that attribution of late 20th century warming is not 100% caused by anthropogenic factors, and attribution to anthropogenic forcing is in the middle tercile (50-50).
The IPCC’s attribution statement does not seem logically consistent with the uncertainty in climate sensitivity.
(d2) Climate variability since 1900
From HadCRUT4:
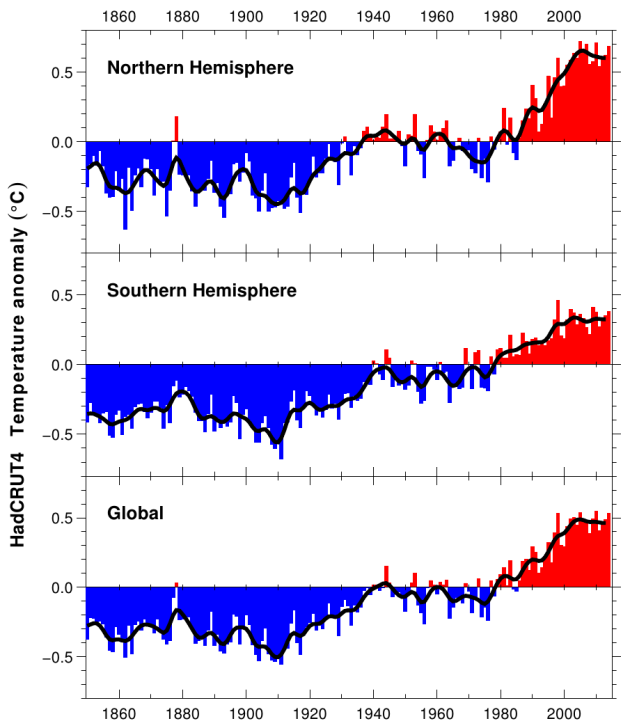
The IPCC does not have a convincing explanation for:
- warming from 1910-1940
- cooling from 1940-1975
- hiatus from 1998 to present
The IPCC purports to have a highly confident explanation for the warming since 1950, but it was only during the period 1976-2000 when the global surface temperatures actually increased.
The absence of convincing attribution of periods other than 1976-present to anthropogenic forcing leaves natural climate variability as the cause – some combination of solar (including solar indirect effects), uncertain volcanic forcing, natural internal (intrinsic variability) and possible unknown unknowns.
A key issue in attribution studies is to provide an answer to the question: When did anthropogenic global warming begin? As per the IPCC’s own analyses, significant warming didn’t begin until 1950. Just the Facts has a good post on this When did anthropogenic global warming begin? {also see this post, with links to authoritative sources}
The temperature record since 1900 is often characterized as a staircase, with periods of warming sequentially followed by periods of stasis/cooling. The stadium wave and Chen and Tung papers, among others, are consistent with the idea that the multidecadal oscillations, when superimposed on an overall warming trend, can account for the overall staircase pattern.
Lets consider the 21st century hiatus. The continued forcing from CO2 over this period is substantial, not to mention ‘warming in the pipeline’ from late 20th century increase in CO2. To counter the expected warming from current forcing and the pipeline requires natural variability to effectively be of the same magnitude as the anthropogenic forcing. This is the rationale that Tung used to justify his 50-50 attribution (see also Tung and Zhou). The natural variability contribution may not be solely due to internal/intrinsic variability, and there is much speculation related to solar activity. There are also arguments related to aerosol forcing, which I personally find unconvincing (the topic of a future post).
The IPCC notes overall warming since 1880. In particular, the period 1910-1940 is a period of warming that is comparable in duration and magnitude to the warming 1976-2000. Any anthropogenic forcing of that warming is very small (see Figure 10.1 above). The timing of the early 20th century warming is consistent with the AMO/PDO (e.g. the stadium wave; also noted by Tung and Zhou). The big unanswered question is: Why is the period 1940-1970 significantly warmer than say 1880-1910? Is it the sun? Is it a longer period ocean oscillation? Could the same processes causing the early 20th century warming be contributing to the late 20th century warming?
Not only don’t we know the answer to these questions, but no one even seems to be asking them!
(e) Attribution
I am arguing that climate models are not fit for the purpose of detection and attribution of climate change on decadal to multidecadal timescales. Figure 10.1 speaks for itself in this regard (see figure 11.25 for a zoom in on the recent hiatus). By ‘fit for purpose’, I am prepared to settle for getting an answer that falls in the right tercile.
The main relevant deficiencies of climate models are:
- climate sensitivity that appears to be too high, probably associated with problems in the fast thermodynamic feedbacks (water vapor, lapse rate, clouds)
- failure to simulate the correct network of multidecadal oscillations and their correct phasing
- substantial uncertainties in aerosol indirect effects
- unknown and uncertain solar indirect effects
So, how to sort this out and do a more realistic job of detecting climate change and and attributing it to natural variability versus anthropogenic forcing? Observationally based methods and simple models have been underutilized in this regard. Of great importance is to consider uncertainties in external forcing in context of attribution uncertainties.
The logic of reasoning about climate uncertainty, is not at all straightforward, as discussed in my paper Reasoning about climate uncertainty.
So, am I ‘making things up’? Seems to me that I am applying straightforward logic. Which IMO has been disturbingly absent in attribution arguments, that use climate models that aren’t fit for purpose, use circular reasoning in detection, fail to assess the impact of forcing uncertainties on the attribution, and are heavily spiced by expert judgment and subjective downweighting.
—————————– End of Professor Curry’s article —————————–
The demand for certainty is one which is natural to man, but is nevertheless an intellectual vice. … To endure uncertainty is difficult, but so are most of the other virtues.
— Bertrand Russell, Philosophy for Laymen (1946)

(2) About Judith Curry
Judith Curry is Professor and Chair of the School of Earth and Atmospheric Sciences at the Georgia Institute of Technology. She is also President and co-owner of Climate Forecast Applications Network (CFAN). Prior to joining the faculty at Georgia Tech, she served on the faculty of the University of Colorado, Penn State University and Purdue University.
She serves on the NASA Advisory Council Earth Science Subcommittee and the DOE Biological and Environmental Science Advisory Committee. She recently served on the National Academies Climate Research Committee and the Space Studies Board, and the NOAA Climate Working Group.
She is a Fellow of the American Meteorological Society, the American Association for the Advancement of Science, and the American Geophysical Union.
Her views on climate change are best summarized by her recent Congressional Testimony:
- Policy Relevant Climate Issues in Context, April 2013
- Rational Discussion of Climate Change: the Science, the Evidence, the Response, November 2010
(3) A few important things to remember about global warming
Please read this before commenting about my views about global warming and climate change. It also has links to the key posts on the FM website on this topic, which in turn link to a wide range of authoritative sources (mostly the IPCC, the major climate agencies, and the peer-reviewed literature).

(4) For More Information
(a) Reference Pages about climate on the FM sites:
- The important things to know about global warming
- My posts
- Studies & reports, by subject
- The history of climate fears
(b) Key posts about the climate change debate:
- When did we start global warming? See the surprising answer., 18 October 2012
- Still good news: global temperatures remain stable, at least for now., 14 October 2012
- Scientists explore causes of the pause in warming, perhaps the most important research of the decade, 17 January 2014
- One of the most important questions we face: when will the pause in global warming end?, 25 August 2013
(c) Speaking about the past, are we prepared for past weather?
- Have we prepared for normal climate change and non-extreme weather?, 11 February 2014
- Droughts are coming. Are we ready for the past to repeat?, 12 March 2014
(d) Posts about extreme weather:
- Ignorance and propaganda about extreme climate change, 10 July 2012
- A look behind the curtain at the news of extreme climate events in the US, 22 August 2012
- Hurricane Sandy asks when did weather become exceptional? (plus important info about US hurricanes), 28 October 2012
- Has global warming increased the frequency & virulence of extreme weather events?, 10 February 2013
- The Oklahoma tornadoes can teach us about our climate, and ourselves, 22 May 2013
- The IPCC gives us straight talk about Extreme Weather, 4 October 2013
- The IPCC rebukes the climate doomsters. Will we listen?, 15 October 2013
- A summary of the state of climate change and extreme weather, 12 December 2013
- Worst case scenarios versus fat tails: a discussion about climate change, 23 April 2014
(5) Advice from the past, from the philosopher Bertrand Russell
.

.
.
